- What is cpu usage linux
- Components of CPU Usage
- Getting the Raw Values
- Viewing CPU Usage
- Monitoring CPU Usage
- Making use of CPU Usage Information
- What are the CPU c-states? How to check and monitor the CPU c-state usage in Linux per CPU and core?
- What are C-states, cstates, or C-modes?
- How can I disable processor sleep states?
- How to read and interpret /dev/cpu_dma_latency?
- What is the maximum C-state allowed for my CPU?
- How do I check the existing latency value for different C-states?
- How to check and monitor the CPU c-state usage in Linux per CPU and core?
- What is POLL idle state ?
What is cpu usage linux
CPU Usage is a picture of how the processors in your machine (real or virtual) are being utilized.
In this context, a single CPU refers to a single (possibly virtualized) hardware hyper-thread. Remember that there might be multiple physical processors in a machine, each with multiple cores, and each core with multiple hyperthreads. In Linux, the hyperthread is the most granular, independently schedulable execution unit. This is the “single CPU”.
Now imagine someone taking a look at all the CPUs every 1/100th of a second, and noting down what type of task each one is executing. There aren’t that many types of tasks (see next section). For each type of task a counter is maintained, so that while sampling if you see that a CPU is executing a particular task type, that counter is incremented. If a CPU executes user code for 1 second, it’s user-code-counter will get incremented by 100.
These counters are maintained by the kernel itself, and can be read from the file /proc/stat (more below).
Note: Technically the magic number 1/100 may be different for your system – you should really be using the value of sysconf(_SC_CLK_TCK) instead.
Components of CPU Usage
So what “types of tasks” are there? The obvious ones are “user” and “system”:
- System: The CPU is running kernel code. This includes device drivers and kernel modules.
- User: The CPU is running code in user-mode. This includes your application code. Note that if an application tries to read from disk or write to network, it actually goes to sleep while the kernel performs that work, and wakes up the application again.
The categorization could stop here, but there a few more, to provide better insight into what is going on:
- Nice: The user code can be executed in “normal” priority, or various degrees of “below normal” priority. You can, for example, run some kind of report generation process at a lower priority and interactive processes at normal priority. Nice is when the CPU is executing a user task having below-normal priority.
- I/O Wait: Sometimes the CPU has only one thing to do – wait for the results of a disk/network read/write. This isn’t as uncommon as you’d think. A file server for example would nearly spend all it’s life waiting for disk reads and network writes to complete. I/O Wait is when the CPU is waiting for an I/O operation to complete, and the CPU can’t be used for anything else.
- Steal: When running in a virtualized environment, the hypervisor may “steal” cycles that are meant for your CPUs and give them to another, for various reasons. This time is accounted for as steal.
- Idle: And when there is really nothing the kernel can do, it just as to waste away this slice of time. Technically, when the runnable queue is empty and there are no I/O operations going on, the CPU usage is marked as idle.
And there are a couple of other types too, which you probably won’t see much of:
- IRQ and SoftIRQ: The kernel is servicing interrupt requests (IRQs).
- Guest and Guest Nice: The process (a hypervisor) is running a virtual CPU. These numbers are already included in User and Nice.
Getting the Raw Values
The CPU usage values are maintained by the kernel, in memory. These values are exposed via the proc filesystem, as the /proc/stat file:
The line with the first field as cpu , shows the actual values of each counter, in this order: user, nice, system, idle, iowait, irq, softirq, steal, guest and guest_nice. These are totalled up numbers for all the CPUs. The remaining lines show the numbers for invidual CPUs (there is only 1 CPU in this example, referred to in the output as cpu0 ).
Viewing CPU Usage
The /proc/stat file is bit hard to parse for humans, though. How can we visualize this data? One tool is top :
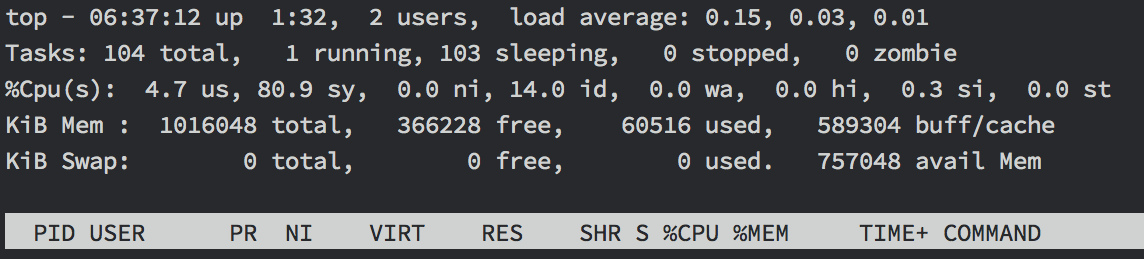
Here top shows the CPU usage as user = 4.7%, system = 80.9% and idle = 14%.
Monitoring CPU Usage
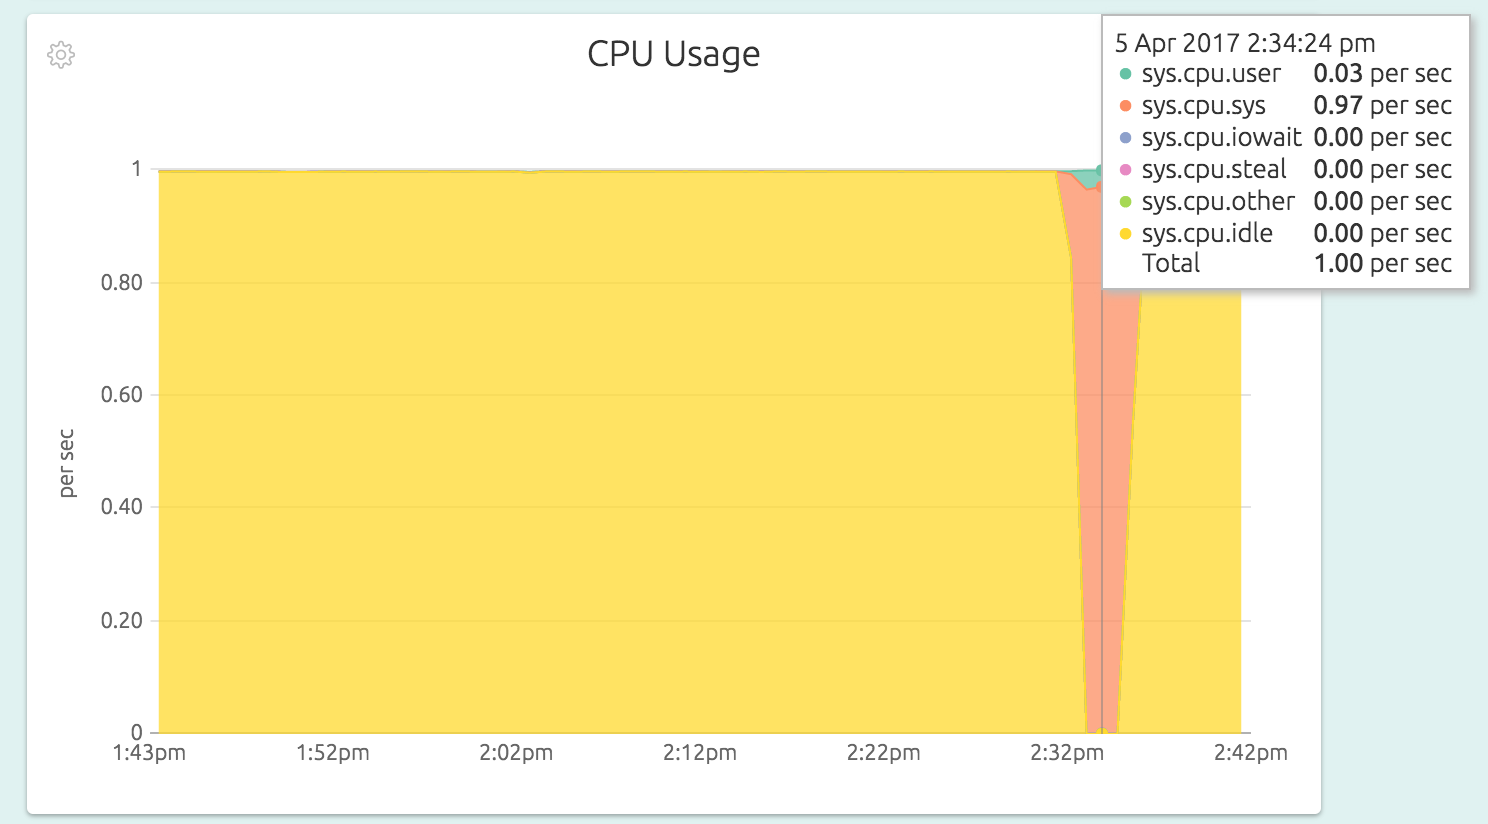
Monitoring your CPU usage using tools like OpsDash affords better understanding and analysis. For example, here is the CPU Usage graph of a node in OpsDash, doing a kernel-intensive operation (allocating and freeing pages of memory, using the stress utility):
This can uncover interesting scenarios, like for example the throttling of CPU in an f1-micro instance on the Google Cloud Platform:
Making use of CPU Usage Information
CPU Usage can be a very “expressive” metric. That is to say, a quick check of the CPU usage graph of a server can reveal a lot about the workload. For example:
- A report generation process runs every day for half a hour. During the period you see a lot of I/O wait – maybe your SQL queries are pulling in too much data? Queries not utilizing indexes?
- Or maybe the report run takes too much user CPU these days – is some algorithm not scaling well with data?
- App server is taking too much system CPU – too many memory allocations/frees/GCs? Too many small disk/network reads/writes?
- User CPU is 100% when page response times are high – you need to optimize your code!
New Here?
OpsDash is a server monitoring, service monitoring, and database monitoring solution for monitoring MySQL, PostgreSQL, MongoDB, memcache, Redis, Apache, Nginx, Elasticsearch and more. It provides intelligent, customizable dashboards and spam-free alerting via email, HipChat, Slack, PagerDuty and Webhooks. Send in your custom metrics with StatsD and Graphite interfaces built into each agent.
14-day free trial — no credit card required
Источник
What are the CPU c-states? How to check and monitor the CPU c-state usage in Linux per CPU and core?

Below list of topics are covered in this article
What are C-states, cstates, or C-modes?
There are various power modes of the CPU which are determined on the basis of their current usage and are collectively called “C-states” or “C-modes.”
The lower-power mode was first introduced with the 486DX4 processor. To the present, more power modes has been introduced and enhancements has been made to each mode for the CPU to consume less power in these low-power modes.
- Each state of the CPU utilises different amount of power and impacts the application performance differently.
- Whenever a CPU core is idle, the builtin power-saving logic kicks in and tries to transition the core from the current C-state to a higher C-state, turning off various processor components to save power
- But you also need to understand that every time an application tries to bind itself to a CPU to do some task, the respective CPU has to come back from its “deeper sleep state” to “running state” that needs more time to wake up the CPU and be again 100% up and running. It also has to be done in an atomic context, so that nothing tries to use the core while it’s being powered up.
- So the various modes to which the CPU transitions are called C-states
- They are usually starting in C0, which is the normal CPU operating mode, i.e., the CPU is 100% turned on
- With increasing C number, the CPU sleep mode is deeper, i.e., more circuits and signals are turned off and more time the CPU will require to return to C0 mode, i.e., to wake-up.
- Each mode is also known by a name and several of them have sub-modes with different power saving – and thus wake-up time – levels.
Below table explains all the CPU C-states and their meaning

How can I disable processor sleep states?
Latency sensitive applications do not want the processor to transition into deeper C-states, due to the delays induced by coming out of the C-states back to C0. These delays can range from hundreds of microseconds to milliseconds.
There are various methods to achieve this.
Method 1
By booting with the kernel command line argument processor.max_cstate=0 the system will never enter a C-state other than zero.
You can add these variable in your grub2 file. Append “ processor.max_cstate=0 ” as shown below
Rebuild your initramfs
Reboot the node to activate the changes
- The second method is to use the Power Management Quality of Service interface (PM QOS).
- The file /dev/cpu_dma_latency is the interface which when opened registers a quality-of-service request for latency with the operating system.
- A program should open /dev/cpu_dma_latency , write a 32-bit number to it representing a maximum response time in microseconds and then keep the file descriptor open while low-latency operation is desired. Writing a zero means that you want the fastest response time possible.
- Various tuned profile can do this by reading the file continously and writing a value based on the input provided foe eg, network-latency, latency-performance etc.
Below is a snippet from latency-performance tuned file
Here as you see this file will always be on open state by the tuned as long as tuned is in running state
These profiles write force_latency as 1 to make sure the CPU c-state does not enters deeper C state other than C1.
How to read and interpret /dev/cpu_dma_latency?
If we use normal text editor tool to read this file then the output would be something like
Since this value is “raw” (not encoded as text) you can read it with something like hexdump.
When you read this further
It tells us that the current latency value time is 2000 seconds which is the time a CPU would need or take to come up from a deeper C state to C0.
When we set a tuned profile with force_latency=1
For example here I will set tuned profile of network-latency
Check the existing active profile
Now lets check the latency value
As you see the latency value has been changed to 1 micro second.
What is the maximum C-state allowed for my CPU?
We have multiple CPU c-states as you can see in the above table but depending upon the latency values and other max_cstate value provided in the GRUB the maximum allowed c-states for any processor can vary.
Below file should give the value from your node
How do I check the existing latency value for different C-states?
The latency value may change depending upon various C-states and the transition time from deeper C-states to C0.
Below command shall give you the existing latency values of all the c-states per cpu
# for state in state <0..4>; do echo c-$state `cat $state/name` `cat $state/latency` ; done
c-state0 POLL 0
c-state1 C1-HSW 2
c-state2 C1E-HSW 10
c-state3 C3-HSW 33
c-state4 C6-HSW 133
Similar value can be grepped for all the available CPUs by changing the cpu number in the above highlighted area.
How to check and monitor the CPU c-state usage in Linux per CPU and core?
You can use “turbostat” tool for this purpose which will give you runtime value for the CPU c-state usage for all the available CPU and cores.
I will be using ‘turbostat’ and ‘stress’ tool to monitor the CPU c-state and put some load on my CPU respectively.
To install these rpms you can use
Case 1: Using throughput-performance tuned profile
To check the currently active profile
With this our latency value is default i.e. 2000 seconds
Check the output using turbostat
As you see all the available CPU and cores are at c-6 state because all are free. Now if I start putting stress then the CPU will start transitioing from C6 to c0 state and c6 will become free as all CPU will be in running state
Core CPU Avg_MHz Busy% Bzy_MHz TSC_MHz IRQ SMI CPU%c1 CPU%c3 CPU%c6 CPU%c7 CoreTmp PkgTmp PkgWatt RAMWatt PKG_%RAM_%
– – 2428 86.63 2804 2599 85363 656 6.08 0.96 6.33 0.00 57 60 119.27 17.04 0.00 0.00
0 0 2377 84.85 2802 2600 5756 41 9.47 1.09 4.59 0.00 55 60 55.56 6.59 0.00 0.00
1 8 1835 65.48 2801 2602 5742 41 20.04 2.11 12.37 0.00 54
2 1 2802 99.93 2803 2601 5037 41 0.07 0.00 0.00 0.00 57
3 9 2802 99.93 2803 2601 5035 41 0.07 0.00 0.00 0.00 56
4 2 2802 99.94 2803 2600 5044 41 0.06 0.00 0.00 0.00 57
5 10 1992 71.12 2802 2598 5688 41 16.62 1.77 10.50 0.00 54
6 3 2799 99.94 2803 2599 5049 41 0.06 0.00 0.00 0.00 57
7 11 1914 68.39 2801 2598 5720 41 18.45 2.09 11.07 0.00 51
0 4 2066 73.79 2800 2600 5335 41 9.85 2.19 14.17 0.00 46 53 63.72 10.45 0.00 0.00
1 12 2803 99.86 2807 2600 5088 41 0.14 0.00 0.00 0.00 52
2 5 656 23.46 2800 2597 3312 41 21.81 6.10 48.63 0.00 45
3 13 2799 99.86 2807 2597 5610 41 0.14 0.00 0.00 0.00 53
4 6 2799 99.86 2807 2597 7143 41 0.14 0.00 0.00 0.00 51
5 14 2799 99.86 2807 2597 5044 41 0.14 0.00 0.00 0.00 50
6 7 2799 99.86 2807 2597 5679 41 0.14 0.00 0.00 0.00 50
7 15 2799 99.86 2807 2597 5081 41 0.14 0.00 0.00 0.00 48
Core CPU Avg_MHz Busy% Bzy_MHz TSC_MHz IRQ SMI CPU%c1 CPU%c3 CPU%c6 CPU%c7 CoreTmp PkgTmp PkgWatt RAMWatt PKG_%RAM_%
– – 2421 86.42 2807 2595 84373 656 6.28 1.07 6.23 0.00 59 62 120.52 17.00 0.00 0.00
0 0 2798 99.83 2808 2595 5039 41 0.17 0.00 0.00 0.00 57 62 55.92 6.54 0.00 0.00
1 8 1891 67.58 2803 2595 5151 41 16.92 2.72 12.78 0.00 55
2 1 2798 99.83 2808 2595 5032 41 0.17 0.00 0.00 0.00 59
3 9 2798 99.83 2808 2595 6068 41 0.17 0.00 0.00 0.00 58
4 2 2798 99.83 2808 2595 5041 41 0.17 0.00 0.00 0.00 58
5 10 1527 54.56 2804 2595 5540 41 24.02 3.73 17.70 0.00 56
6 3 2793 99.83 2808 2590 5045 41 0.17 0.00 0.00 0.00 58
7 11 1692 60.57 2804 2590 5556 41 20.66 3.24 15.53 0.00 54
0 4 1425 50.99 2800 2595 5251 41 19.20 4.24 25.57 0.00 48 57 64.60 10.46 0.00 0.00
1 12 2799 99.85 2809 2595 5053 41 0.15 0.00 0.00 0.00 54
2 5 2799 99.84 2809 2595 5054 41 0.16 0.00 0.00 0.00 53
3 13 1419 50.79 2800 2595 4642 41 17.88 3.22 28.11 0.00 49
4 6 2799 99.85 2809 2595 5059 41 0.15 0.00 0.00 0.00 55
5 14 2799 99.84 2809 2595 5047 41 0.16 0.00 0.00 0.00 53
6 7 2799 99.84 2809 2595 6206 41 0.16 0.00 0.00 0.00 53
7 15 2801 99.84 2809 2597 5589 41 0.16 0.00 0.00 0.00 50
Now towards the end as you see the Busy% increases and the CPU state under c-6 is reduced which means the CPU are currently in running state.
Case 2: Change tuned profile to latency-performance
Next monitor the CPU c-state when the system is idle
As you see even when the CPU and cores are sitting idle still the CPU won’t transition to deeper c-states since we are forcing it to stay at C1
What is POLL idle state ?
If cpuidle is active, X86 platforms have one special idle state. The POLL idle state is not a real idle state, it does not save any power. Instead, a busy-loop is executed doing nothing for a short period of time. This state is used if the kernel knows that work has to be processed very soon and entering any real hardware idle state may result in a slight performance penalty.
There exist two different cpuidle drivers on the X86 architecture platform:
“acpi_idle” cpuidle driver
The acpi_idle cpuidle driver retrieves available sleep states (C-states) from the ACPI BIOS tables (from the _CST ACPI function on recent platforms or from the FADT BIOS table on older ones). The C1 state is not retrieved from ACPI tables. If the C1 state is entered, the kernel will call the hlt instruction (or mwait on Intel).
“intel_idle” cpuidle driver
In kernel 2.6.36 the intel_idle driver was introduced. It only serves recent Intel CPUs (Nehalem, Westmere, Sandybridge, Atoms or newer). On older Intel CPUs the acpi_idle driver is still used (if the BIOS provides C-state ACPI tables). The intel_idle driver knows the sleep state capabilities of the processor and ignores ACPI BIOS exported processor sleep states tables.
Источник


